
Understanding Property Cashflow Calculations: Before-Tax, After-Tax, and What the Numbers Actually Mean
Why Cashflow Is the Metric That Keeps Investors Up at Night
Capital growth is exciting. Yield percentages look clean on a spreadsheet. But cashflow is what hits your bank account every month — and it’s the number that determines whether owning an investment property feels comfortable or stressful.
Key Takeaways
- Cashflow has multiple layers: gross rent → vacancy → operating expenses → mortgage → tax effects
- Operating expenses typically run 25–35% of gross rent for houses, 30–45% for units with strata
- Depreciation is a non-cash deduction that can shift after-tax cashflow from negative to neutral or positive
- Always stress-test cashflow at current rates +1% and +2% — don't rely on a single rate scenario
- Neither positive nor negative cashflow is inherently "better" — it depends on your strategy and financial position
The challenge is that cashflow isn’t a single number. It’s a calculation with multiple layers, each one adding or subtracting from your bottom line. Gross rent, operating expenses, mortgage repayments, tax deductions, depreciation — they all interact to produce your actual out-of-pocket position.
Understanding each layer matters because small errors or omissions compound. Forgetting strata fees, underestimating maintenance, or misunderstanding how depreciation works can turn a “positive cashflow” projection into a negative reality. This guide walks through every component of a property cashflow calculation, explains what each number means, and shows you where the common traps are.
The Cashflow Waterfall: From Gross Rent to Your Pocket
Think of property cashflow as a waterfall. Money flows in at the top (rent) and gets reduced at each level as expenses are deducted. What reaches the bottom is your actual cashflow position.
Level 1: Gross Rental Income
This is the total annual rent your property could earn if tenanted 52 weeks per year at the current market rate. If your property rents for $550/week, gross rental income is $28,600 per year.
Key assumption to watch: Most projections use the current asking rent or a rental estimate. But your actual income depends on what a tenant will actually pay, which may differ from estimates. Rental estimates are based on comparable properties in the area, but every property is different — condition, aspect, parking, and presentation all affect achievable rent.
Level 2: Vacancy Allowance
No property is tenanted 100% of the time forever. Between tenancies, there’ll be periods of vacancy for advertising, inspections, cleaning, and minor repairs. A standard vacancy allowance is 2–4 weeks per year (roughly 4–8% of gross rent), though this varies by market.
In tight rental markets (vacancy rates under 1.5% — markets like Kirwan, QLD currently sit around 1%), actual vacancy might be closer to 1 week per year. In softer markets, it could be 4–6 weeks. Using a blanket “2 weeks” assumption across all markets can significantly overstate or understate your real income.
Effective gross income = Gross rent minus vacancy allowance. Using our example: $28,600 – $1,100 (2 weeks) = $27,500.
Level 3: Operating Expenses
These are the costs of owning and maintaining the property, excluding mortgage repayments. They typically include:
- Property management fees: Usually 7–10% of collected rent (including GST in some states). On $27,500 effective income, that’s roughly $1,925–$2,750.
- Council rates: Vary dramatically by LGA. Can be $1,200/year in a low-rate area or $3,500+ in some metro councils.
- Water rates: Usually $600–$1,200/year (some passed to tenant, varies by state).
- Insurance: Landlord insurance typically $1,000–$2,000/year, depending on property value and location. Flood/cyclone-prone areas can be significantly more.
- Strata/body corporate fees: For units and townhouses, $2,000–$8,000+/year. This is the expense most commonly underestimated by new investors. Older buildings with lifts, pools, or deferred maintenance can have very high strata levies.
- Maintenance and repairs: Budget 1–2% of property value per year as a long-term average. A $500,000 property should budget $5,000–$10,000/year. New properties will be lower; older properties will be higher.
- Land tax: Varies by state and depends on total landholding value. Some states have investor-specific surcharges. Often forgotten in quick cashflow calculations.
Net Operating Income (NOI) = Effective gross income minus all operating expenses.
This is the property’s income after all costs of ownership but before any mortgage payments. NOI tells you how the property performs as an asset, independent of how you’ve financed it.
Using ballpark numbers for our example: $27,500 – $10,500 (total operating expenses) = $17,000 NOI.
Level 4: Mortgage Repayments
This is where your financing structure dramatically affects cashflow. The same property can be cashflow positive or cashflow negative depending on:
- Loan amount: Larger deposit = smaller loan = lower repayments = better cashflow
- Interest rate: Every 0.5% rate increase on a $400,000 loan adds roughly $2,000/year to repayments
- Loan type: Interest-only loans have significantly lower repayments than principal-and-interest (P&I) loans, improving short-term cashflow but not reducing debt
- Loan term: A 30-year loan has lower repayments than a 25-year loan (but costs more in total interest)
Cashflow before tax = NOI minus mortgage repayments (interest component for tax purposes, or total repayment for actual cashflow).
This is the number that tells you how much money you’re actually putting in or taking out of your pocket each month, before considering tax effects.
If NOI is $17,000 and annual mortgage interest is $24,000 (on a $400,000 loan at 6%), cashflow before tax is –$7,000, meaning you’re contributing $583/month to hold this property.
Level 5: Tax Effects
Australia’s tax system significantly affects property cashflow through several mechanisms:
Negative gearing: If your property makes a loss (expenses including interest exceed income), that loss can be offset against your other income (salary, business income, etc.), reducing your overall tax bill. The tax saving reduces your real out-of-pocket cost.
If you’re on a 37% marginal tax rate and your property loss is $7,000/year, the tax offset is approximately $2,590. Your after-tax cashflow is –$4,410/year (–$368/month) rather than –$7,000.
Depreciation: This is the non-cash deduction that often confuses investors. Depreciation allows you to claim a tax deduction for the wear and tear on the building structure (capital works — typically 2.5% per year for buildings constructed after 1985) and fixtures/fittings (plant and equipment — varies by asset, often 10–40% per year declining).
The critical thing to understand: depreciation is a tax deduction, not an actual expense. You don’t pay depreciation — it’s a paper loss that reduces your taxable income. This means it improves your after-tax cashflow without costing you money.
A new property might have $8,000–$12,000 in first-year depreciation deductions. On a 37% tax rate, that’s an additional $2,960–$4,440 in tax savings. For some investors, depreciation is what makes the difference between negative and positive after-tax cashflow.
Cashflow after tax = Cashflow before tax + tax offset (from negative gearing + depreciation benefits).
Continuing our example: –$7,000 + $2,590 (negative gearing tax benefit) + $3,700 (depreciation tax benefit) = –$710/year. The property costs $59/month after tax — dramatically less than the $583/month before-tax figure suggested.
Where Cashflow Projections Go Wrong
Underestimating Operating Expenses
The most common error. Many quick calculators include management fees and insurance but omit land tax, strata levies, or use unrealistically low maintenance budgets. A projection showing “$5,000/year operating expenses” on a $600,000 unit with strata should be questioned immediately.
Rule of thumb: Total operating expenses for a house are typically 25–35% of gross rent. For a unit with strata, 30–45%. If your projection shows less than this, check what’s been omitted.
Using Interest-Only Assumptions for P&I Reality
Many cashflow projections model interest-only repayments because the numbers look better. But most investor loans revert to P&I after 5 years (or regulators may restrict IO lending further). When P&I kicks in, monthly repayments typically jump 25–40%, which can turn a slightly positive cashflow property into a meaningfully negative one.
Always check whether a projection uses IO or P&I assumptions, and model both scenarios.
Ignoring Rate Sensitivity
A cashflow projection at today’s rate is a snapshot, not a forecast. Interest rates can move 1–2% over a typical investment hold period. On a $400,000 loan, a 1% rate increase adds approximately $4,000/year to repayments. If your cashflow is currently +$2,000/year, a 1% rate rise puts you at –$2,000/year.
Stress test: Model your cashflow at current rates, +1%, and +2%. If the property only works at today’s rate, you’re exposed.
Overestimating Rental Growth
Projections that show cashflow “turning positive in year 3” are often relying on assumed rental growth of 4–5% per year. While this is achievable in tight markets, it’s not guaranteed. If rents grow at 2% instead of 5%, the breakeven point shifts years into the future.
Forgetting Vacancy in Good Markets
Even in markets with sub-1% vacancy rates, you’ll still have periods without rent — between tenancies, during maintenance, or if a tenant breaks their lease. Budget at least 1–2 weeks per year even in the tightest markets.
How to Read a Cashflow Projection Properly
When you see a cashflow projection (whether from a buyer’s agent, a data platform, or your own spreadsheet), ask these questions:
1. What rental figure is being used, and where did it come from?
Is it the current actual rent, a market estimate, or an optimistic projection? If it’s an estimate, how does it compare to actually listed rents in the same suburb for similar properties?
2. What expenses are included?
Check for: management fees, council rates, water rates, insurance, strata (if applicable), maintenance allowance, and land tax. If any are missing, the projection is incomplete.
3. What loan assumptions are being used?
Interest rate, loan amount, loan type (IO vs P&I), and loan term all affect the result. Make sure these match your actual financing situation, not a theoretical optimum.
4. Are tax effects included? If so, at what tax rate?
After-tax projections depend on your marginal tax rate. A projection calculated at a 45% tax rate looks much better than one at 30%, because the tax offsets are larger. Make sure the assumed rate matches yours.
5. Is depreciation included? Is it realistic?
New properties have substantial depreciation deductions. Established properties (especially pre-1985 buildings) have much less. A depreciation figure should ideally come from a quantity surveyor’s estimate or be based on the property’s age and construction cost.
6. What growth assumptions are built in?
Some projections show cashflow improving over 5–10 years based on assumed rental growth and/or capital growth. Check the growth rate used — is it conservative (2–3%) or optimistic (5–7%)?
Positive vs Negative Cashflow: Neither Is Inherently Better
There’s a persistent debate in Australian property investing about whether positive or negative cashflow is “better.” The answer depends entirely on your circumstances.
When Negative Cashflow Can Make Sense
- You have high PAYG income and benefit significantly from negative gearing tax offsets
- The property is in a high-growth location where capital appreciation will far exceed the annual cash shortfall
- You have sufficient cash reserves to comfortably cover the shortfall without financial stress
- You’re early in your investing journey with a long time horizon for growth to compound
When Positive Cashflow Is Important
- You’re approaching retirement and need income from your portfolio
- You have limited surplus income and can’t afford to subsidise a property
- You’re building a larger portfolio and need each property to be self-sustaining to support further borrowing
- Interest rates are volatile and you want to minimise rate exposure
The Transition
Most negative cashflow properties become cashflow positive over time as rents increase while mortgage repayments (particularly on fixed or slowly adjusting rates) remain relatively stable. The question is how long that transition takes and whether you can afford the shortfall in the meantime.
A property that costs you $5,000/year today but will be cashflow positive in 3–4 years (due to rental growth) is a very different proposition from one that won’t break even for 8–10 years.
Key Metrics Beyond Simple Cashflow
Cash-on-Cash Return
This measures your year-one cash return on the actual money you invested (deposit plus all purchase costs). If you invested $120,000 (deposit, stamp duty, legal fees) and your after-tax cashflow is –$3,000/year, your cash-on-cash return is –$2.5%. If it’s +$4,000/year, your cash-on-cash return is +3.3%.
Cash-on-cash return is useful for comparing different investment opportunities, including non-property alternatives, on a like-for-like basis.
Internal Rate of Return (IRR)
IRR accounts for all cash flows over the investment period — your initial outlay, annual cashflows (positive or negative), and the eventual sale proceeds. It gives you an annualised return figure that accounts for the time value of money.
A property with negative cashflow for 5 years but strong capital growth might have a higher IRR than a positive cashflow property with modest growth. IRR is the most comprehensive single measure of investment performance, but it requires assumptions about the sale price and timing.
Payback Period
How many years until your cumulative net cashflow recovers your initial investment. A 6–7 year payback period is generally considered reasonable for property investment, though this varies with strategy.
Practical Tips for Cashflow Management
- Maintain a cash buffer. Keep 6–12 months of holding costs in an accessible savings account. This protects against vacancy, unexpected repairs, or rate increases.
- Review annually. Rental markets change, rates change, and expenses change. Recalculate your cashflow position at least once a year.
- Get a depreciation schedule. A quantity surveyor’s report (typically $600–$800) can identify thousands of dollars in annual tax deductions you’d otherwise miss.
- Monitor your loan structure. When your IO period expires, be ready for the P&I jump. Consider whether refinancing to extend IO (if available) or accelerating repayments makes more sense.
- Track actual vs projected. After 12 months of ownership, compare your actual cashflow to the projection you used when buying. The differences will teach you which assumptions to trust and which to question next time.
Frequently Asked Questions
Q: What is the difference between before-tax and after-tax property cashflow?
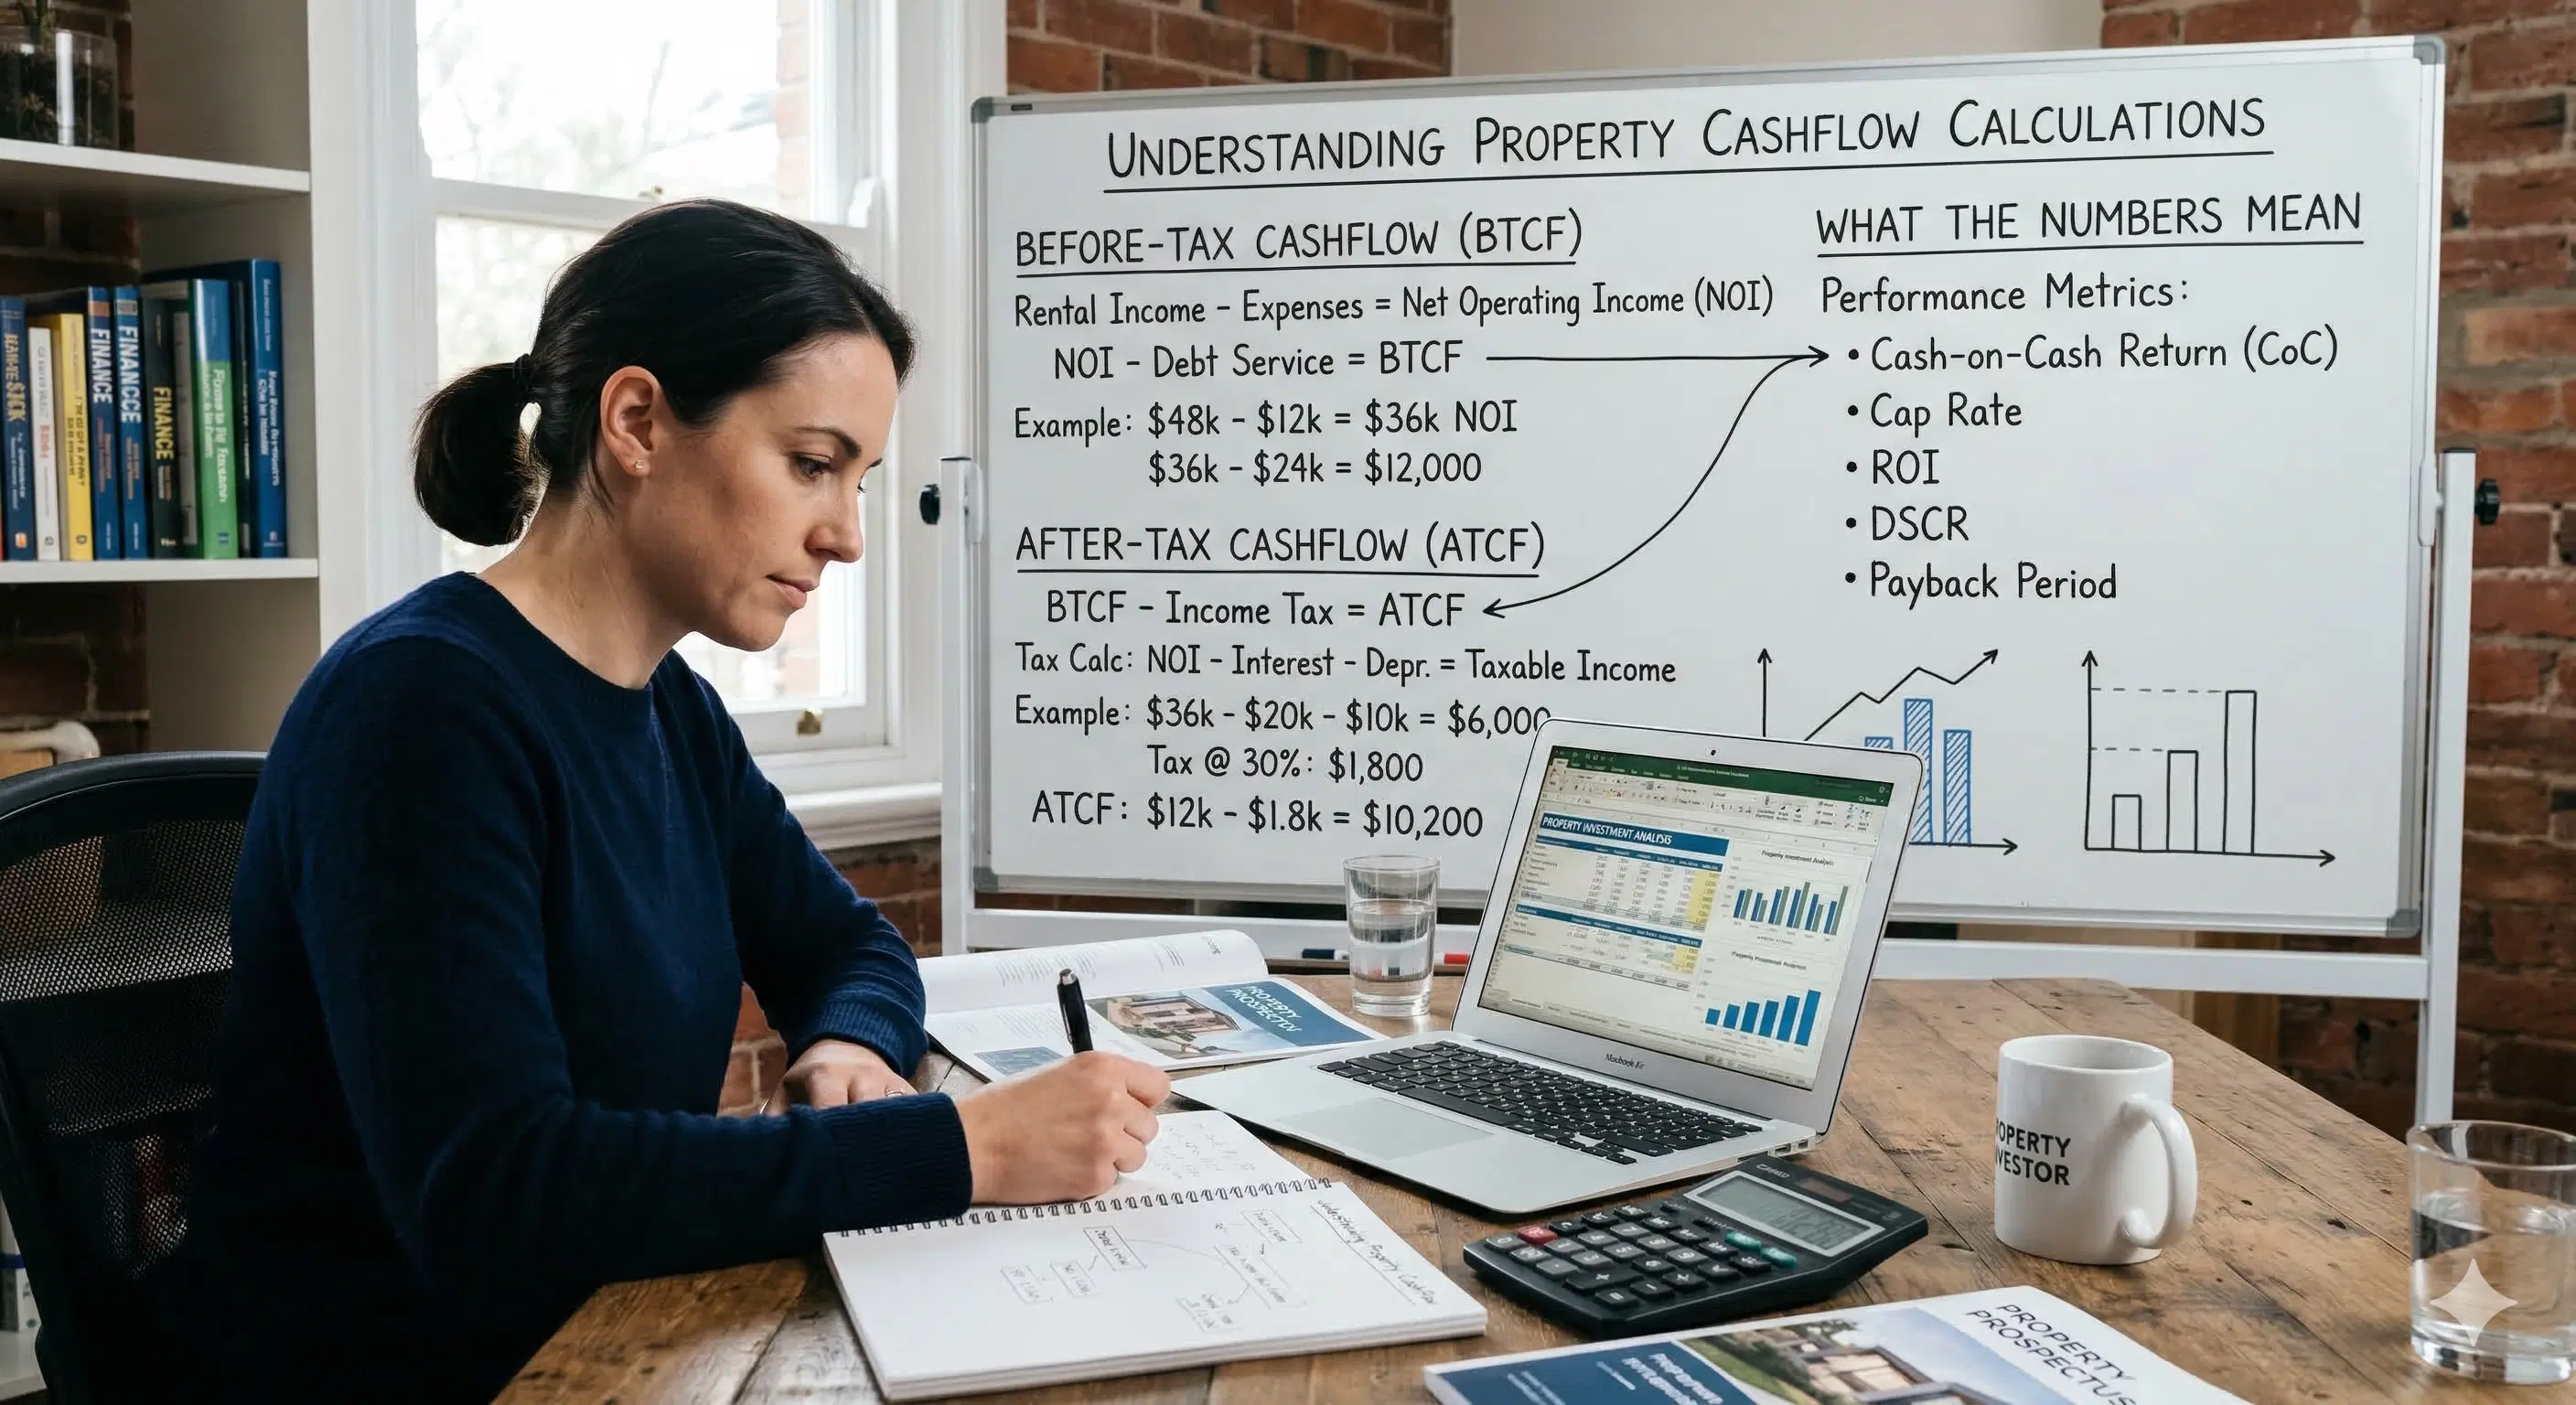
A: Before-tax cashflow is your rental income minus all expenses and mortgage payments — what hits your bank account. After-tax cashflow factors in tax benefits from negative gearing and depreciation deductions, which can significantly reduce your actual out-of-pocket cost.
Q: How much should I budget for operating expenses?
A: For houses: 25–35% of gross rent (management fees, rates, insurance, maintenance). For units/townhouses with strata: 30–45%. Always include council rates, water rates, landlord insurance, management fees, maintenance, and land tax in your calculations.
Q: When will my negatively geared property become cashflow positive?
A: It depends on rental growth rates, interest rate movements, and your loan structure. With 5% annual rental growth, many properties transition from negative to positive within 3–5 years. With 2% growth, it could take 8–10+ years. Model multiple scenarios before buying.
Q: Should I choose interest-only or principal-and-interest for my investment loan?
A: Interest-only loans improve short-term cashflow significantly (repayments 25–40% lower) but don't reduce debt. Most IO periods expire after 5 years, causing a payment jump. Consider your strategy: IO for maximising early cashflow, P&I for building equity faster.
The Bottom Line
Property cashflow is more nuanced than most investors initially realise. The gap between “gross yield looks great” and “my actual bank balance each month” is filled with operating expenses, loan structures, tax effects, and assumptions that each need scrutiny.
The investors who manage cashflow well aren’t necessarily the ones with the highest-yielding properties — they’re the ones who understood every layer of the calculation before they bought, stress-tested the numbers across different scenarios, and maintained buffers for the inevitable surprises.
Whether your property is cashflow positive or negative matters less than whether you understood and planned for whichever outcome you got.
Picki’s property analysis tools calculate Net Operating Income, before-tax cashflow, after-tax cashflow, depreciation estimates, cash-on-cash return, and IRR for any property in Australia. See how the numbers stack up before you buy.
