

Understanding Vendor Discounting: What Seller Pricing Patterns Reveal About Your Target Suburb
When you're researching a suburb for investment, most people jump straight to the median price and rental yield. But there's a quieter, less glamorous metric that experienced investors watch closely: vendor discounting.
What Is Vendor Discounting?
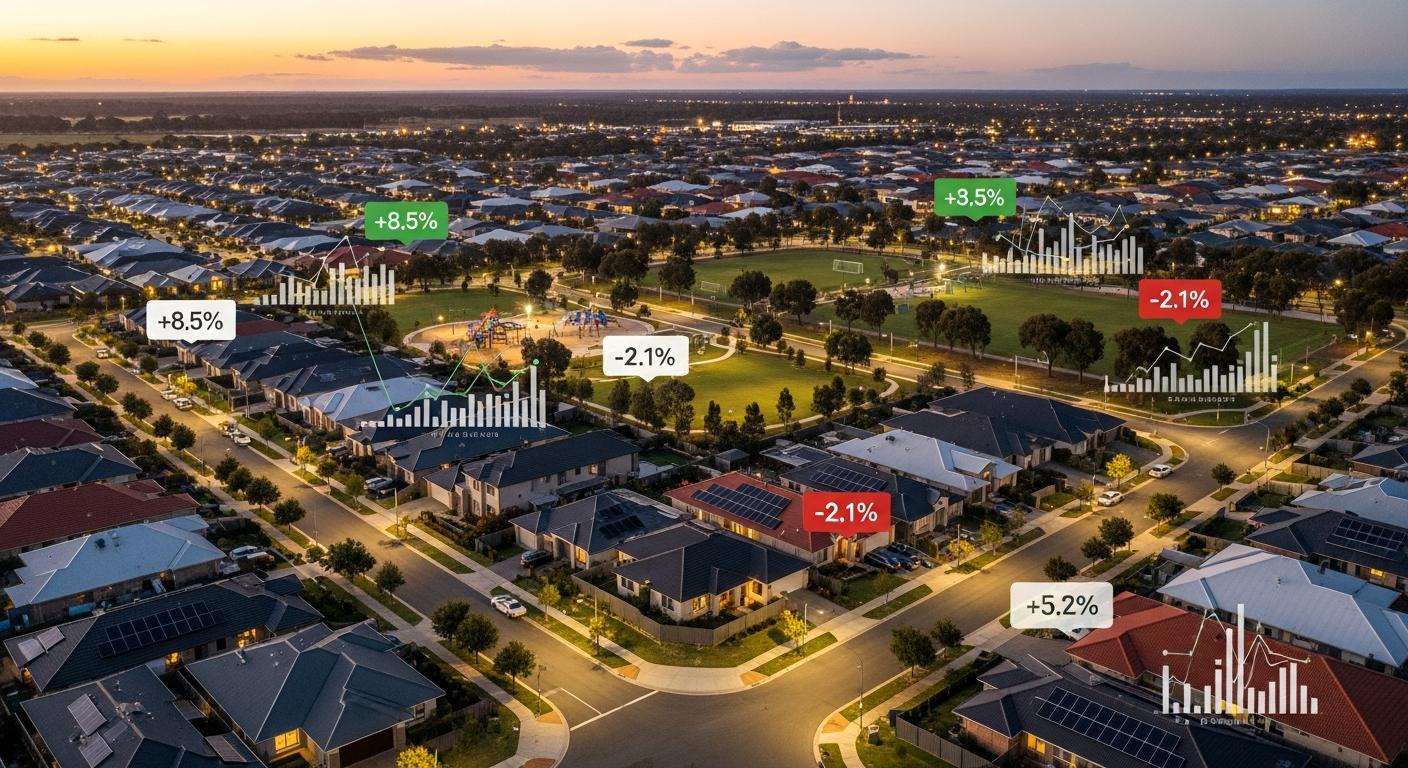
Vendor discounting is the percentage difference between the original asking price (or price guide) and the final sale price of a property. It's expressed as a percentage, and the direction tells you who holds the power in a given market.
When vendor discounting is negative — say, -5% — it means sellers are, on average, accepting 5% less than their asking price. That's a buyer's market signal. Purchasers have leverage. Negotiations are real.
When vendor discounting is near zero or positive, properties are selling at or above asking price. Buyers are competing, often pushing prices beyond the guide. That's a seller's market.
This distinction matters enormously for investors, because it directly affects your entry price — and every dollar you save on purchase directly improves your yield, cash flow, and long-term returns.
Why Vendor Discounting Is a Leading Indicator
Most property metrics are lagging indicators. Median prices tell you what already happened. Auction clearance rates reflect last Saturday's results. Even rental yields are calculated from rents that were set weeks or months ago.
Vendor discounting is different. It captures the current negotiation dynamics between buyers and sellers in real time. When discounting starts to narrow (moving from, say, -6% toward -2%), it often signals that buyer demand is increasing — even before median prices visibly rise.
Conversely, when discounting widens (moving from -2% toward -7%), it suggests the market is cooling. Sellers are having to give more ground. This can happen months before the headline median price drops.
For investors who are trying to time their entry between capital growth and cash flow strategies, vendor discounting provides an early signal that other metrics simply don't capture.
How to Interpret Vendor Discounting Numbers
Here's a general framework for reading vendor discounting at the suburb level:
Strong Buyer's Market: -7% or more
Sellers are significantly reducing their expectations. This often occurs in suburbs with high stock on market, rising vacancy rates, or economic headwinds. While it creates negotiation opportunities, investigate why sellers are desperate before assuming it's a bargain.
Moderate Buyer's Market: -3% to -7%
This is a healthy range for investors. There's enough competition to maintain reasonable valuations, but sellers are willing to negotiate. Properties in this range typically sit on the market for 30–60 days, giving you time to conduct proper due diligence.
Balanced Market: -1% to -3%
Properties sell close to asking. Neither buyers nor sellers have a dominant advantage. These markets often see steady, predictable price movements — which can be ideal for investors who prioritise stability over aggressive negotiation.
Seller's Market: 0% or positive
Properties are selling at or above asking price. Multiple offers are common. In these conditions, investors need to be disciplined about their maximum purchase price. The risk of overpaying is real, and median prices can be misleading when they're inflated by competitive bidding.
The Relationship Between Vendor Discounting and Other Metrics
Vendor discounting doesn't exist in isolation. It's most powerful when read alongside complementary data points.
Vacancy Rates
Suburbs with tight vacancy rates (under 2%) and narrowing vendor discounting are often entering a growth phase. Strong rental demand tells you tenants want to be there; narrowing discounting tells you buyers do too. As we've explored in our analysis of Australia's tightest rental markets, these two metrics together paint a compelling picture.
Days on Market
If vendor discounting is narrowing but days on market is still elevated, the market may be in early recovery — sellers are getting closer to their asking prices, but it's still taking time to find buyers. If both metrics are tightening simultaneously, demand is genuinely strengthening.
Stock on Market
High listing volumes combined with wide vendor discounting is a clear signal of oversupply. Buyers have choices, and sellers are competing against each other. Low stock with narrow discounting? That's a constrained market where any new listing gets snapped up quickly.
Owner-Occupier Ratio
Suburbs with high owner-occupier ratios tend to have lower vendor discounting because owner-occupiers are more emotionally attached to price expectations. Investment-heavy suburbs may see wider discounting as investors make decisions purely on numbers. Understanding the owner-occupier ratio dynamics helps contextualise the discounting data you're seeing.
Using Vendor Discounting in Your Suburb Research
Here's how to practically apply vendor discounting when evaluating suburbs:
Step 1: Compare Across Your Shortlist
Pull up vendor discounting for each suburb you're considering. If you're comparing Point Cook against Tarneit, the discounting gap tells you where buyers currently have more leverage. A suburb with -5% discounting gives you materially better negotiation conditions than one at -1%.
Step 2: Track the Trend, Not Just the Number
A suburb sitting at -4% discounting could be improving (coming from -8%) or deteriorating (coming from -1%). The direction matters more than the absolute number. Picki data shows vendor discounting trends over time at the suburb level, so you can see whether conditions are tightening or loosening.
Step 3: Calibrate Your Offer Strategy
In a suburb showing -5% average vendor discounting, an offer 7-8% below asking is aggressive but not unreasonable. In a suburb at -1%, the same offer would likely be rejected outright. Let the data inform your negotiation range rather than guessing.
Step 4: Cross-Reference with Comparable Sales
Vendor discounting at the suburb level is an average. Individual properties may deviate significantly. A motivated seller (divorce, relocation, financial pressure) might accept 10% below asking even in a tight market. Always verify with recent comparable sales in the immediate area.
Case Study: Growth Corridors vs Established Suburbs
Vendor discounting patterns often differ systematically between growth corridors and established suburbs.
In outer growth corridors — think suburbs within the City of Wyndham or similar high-development LGAs — vendor discounting tends to be wider because new housing supply creates constant competition. Developers price aggressively, and resale properties need to compete.
In established suburbs with limited land and minimal new construction, vendor discounting is typically narrower. There's less supply competing for buyer attention, and the scarcity of listings gives sellers more pricing power.
Neither pattern is inherently better for investors. Wide discounting in growth corridors can mean excellent entry prices if demand fundamentals (population growth, infrastructure investment, employment) are strong. Narrow discounting in established areas reflects stability but potentially limits your negotiation upside.
According to Picki's analysis, the most interesting investment opportunities often emerge when vendor discounting in a growth corridor starts narrowing — it suggests the initial oversupply from new development is being absorbed, and genuine demand is taking over.
Common Mistakes When Reading Vendor Discounting
Mistake 1: Ignoring Sample Size
In suburbs with very few sales per quarter (under 10-15), the vendor discounting figure can be skewed by a single outlier transaction. Always check the sales volume alongside discounting data. The metric is most reliable in suburbs with consistent transaction volumes.
Mistake 2: Comparing Across Property Types
A suburb's overall vendor discounting might show -3%, but this could mask wildly different dynamics between houses and units. Houses might be selling at asking while units are being heavily discounted. If possible, filter by dwelling type for a clearer picture.
Mistake 3: Assuming Wide Discounting Means Bargains
Sometimes wide discounting simply reflects a genuinely declining market. If a suburb has -8% vendor discounting, rising vacancy, falling rents, and population decline, the low prices may be justified — and could fall further. Discounting is an opportunity signal, not a buy signal in itself. Pair it with proper cashflow analysis to make sound decisions.
What Vendor Discounting Tells You About Market Cycles
Vendor discounting follows a predictable pattern through the property cycle:
Recovery phase: Discounting narrows from deep negative territory. Sellers still accept below asking, but the gap is shrinking. This is often the optimal entry point for investors.
Growth phase: Discounting approaches zero and may turn positive. Properties attract multiple offers. This is where most buyers enter — but also where overpaying risk is highest.
Peak/plateau: Discounting hovers near zero but listings start to rise. The market appears strong, but the supply-demand balance is shifting.
Correction phase: Discounting widens again as sellers struggle to attract buyers at elevated prices. Price expectations lag reality, and properties sit on the market longer.
Understanding where your target suburb sits in this cycle — which vendor discounting helps you identify — is one of the most important inputs for timing your investment decisions.
Frequently Asked Questions
What is a good vendor discounting rate for property investors?
For investors seeking negotiation leverage, vendor discounting between -3% and -7% typically offers a good balance. It's wide enough to negotiate meaningfully below asking price, but not so wide that it signals a distressed market. The key is to look at the trend direction — narrowing discounting in the -3% to -5% range often signals an ideal entry window before prices start rising.
How is vendor discounting calculated?
Vendor discounting is calculated by comparing the original listing price (or price guide) to the actual sale price, expressed as a percentage. For example, if a property was listed at $500,000 and sold for $475,000, the vendor discount is -5%. At the suburb level, this is averaged across all sales within a given period (typically a rolling 90-day or 12-month window) to show the overall market trend.
Does vendor discounting apply to auction sales?
Auction sales are typically excluded or treated differently in vendor discounting calculations because auctions don't have a fixed asking price — they have a price guide or reserve. In auction-heavy markets (like parts of Melbourne and Sydney), the metric may be less representative. For suburbs where most sales are by private treaty, vendor discounting is a highly reliable indicator of market conditions.
How often should I check vendor discounting for my target suburbs?
Monthly monitoring is sufficient for most investors. Vendor discounting shifts gradually rather than dramatically week-to-week. Picki updates vendor discounting data regularly at the suburb level, so adding your target suburbs to your watchlist ensures you'll notice meaningful trend changes without needing to check constantly.
Can vendor discounting predict property price movements?
Vendor discounting is one of the more reliable leading indicators of price direction. Consistently narrowing discounting over 3-6 months frequently precedes median price increases, because it reflects growing buyer competition in real time. However, no single metric predicts price movements with certainty — always combine vendor discounting with vacancy rates, days on market, and supply data for a complete picture.
Ready to track vendor discounting across your target suburbs? Explore Picki's suburb research tools to see how this metric — and dozens of others — can sharpen your investment analysis.