
Australian Capital City Property Prices Q1 2026: What the Divergence Means for Investors
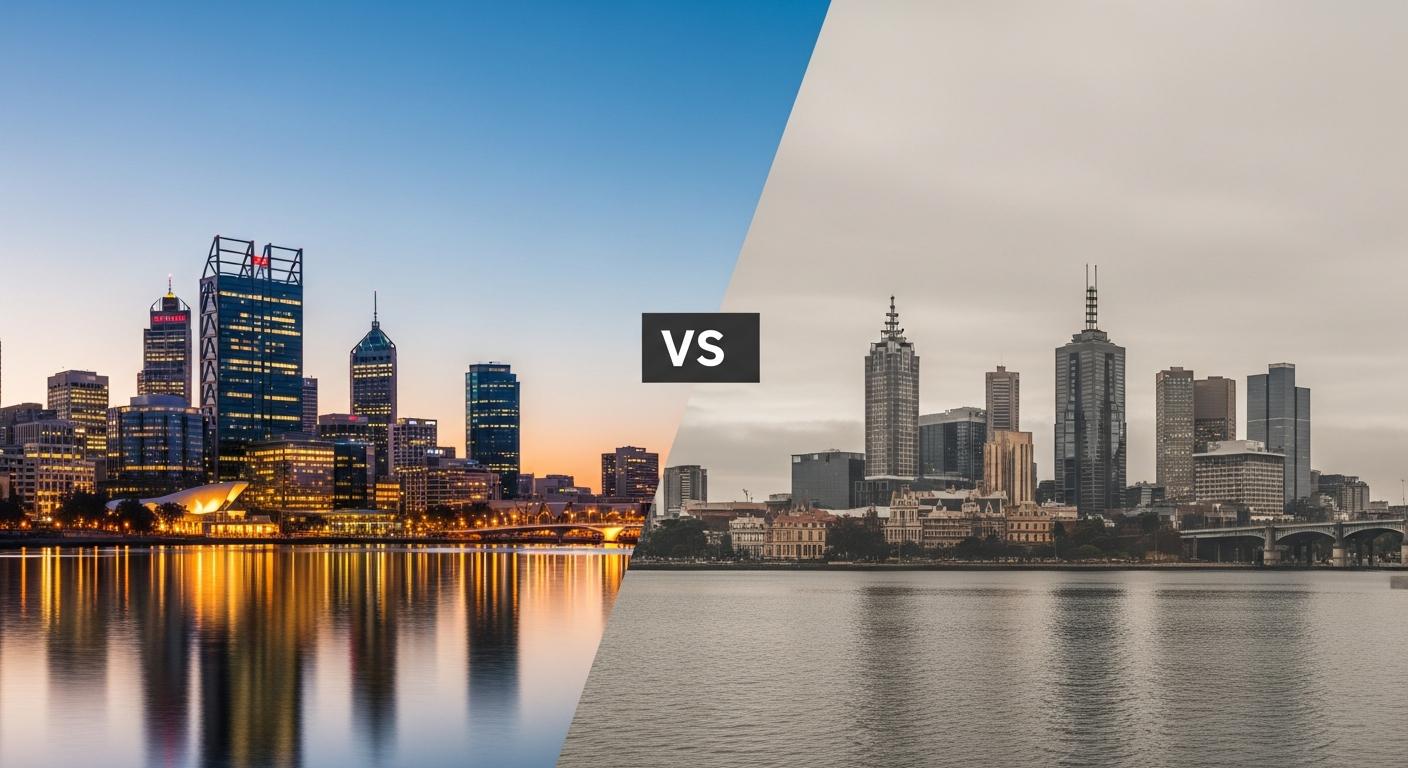
The first quarter of 2026 delivered one of the most dramatic divergences between Australian capital city property markets in recent memory. Cotality (formerly CoreLogic) data released on 1 April 2026 confirmed what many investors had suspected: the era of all cities rising together is over. Perth dwelling values surged 7.3% for the quarter while Melbourne fell 0.6% and Sydney dipped 0.2%.
For property investors, this divergence is not just a headline — it is a fundamental shift in how capital city markets are behaving, and understanding the drivers behind each city’s performance is essential for making informed investment decisions in the months ahead.
The Q1 2026 Scorecard: Every Capital City’s Performance
Here is the complete Cotality data for the quarter ending 31 March 2026:
The national median dwelling value now sits at $933,137. But this national figure obscures enormous variation. The gap between Perth’s quarterly growth (+7.3%) and Melbourne’s decline (-0.6%) is 7.9 percentage points — a spread that would have been unusual even during previous divergence cycles.
What Is Driving Perth, Brisbane, and Adelaide Higher?
The three standout performers share a common thread: strong population growth colliding with constrained housing supply.
Perth: Supply Squeeze Meets Interstate Migration
Perth’s 24.3% annual growth and 7.3% quarterly surge make it the strongest capital city market in Australia. According to Picki’s analysis of property demand drivers, several factors are compounding:
- Population growth: Western Australia continues to attract interstate and international migrants, driven by mining sector employment and relative affordability compared to eastern states
- Supply constraints: New dwelling construction has not kept pace with demand. Perth’s building pipeline remains below pre-pandemic levels, creating a population-to-supply imbalance
- Tight rental market: Perth’s vacancy rates remain among the lowest in the country, supporting both rental yields and investor confidence
Brisbane: Momentum Continues Pre-Olympics
Brisbane’s median dwelling value has crossed $1.1 million, with 19% annual growth. The Queensland capital benefits from:
- Sustained interstate migration from New South Wales and Victoria
- Infrastructure investment ahead of the 2032 Olympics
- A median price point that, while now above $1 million, remains below Sydney
Adelaide: The Quiet Achiever
Adelaide’s 11.4% annual growth reflects a maturing cycle. South Australia’s relative affordability, with a median of $937,021, continues to attract investors and owner-occupiers priced out of larger eastern markets. Employment diversity across defence, health, and education sectors provides economic stability.
Why Sydney and Melbourne Are Falling Behind
Sydney and Melbourne’s negative quarterly results mark a meaningful shift from the growth seen in 2024 and early 2025.
The Affordability Ceiling
Sydney’s median dwelling value of $1,295,387 makes it increasingly difficult for buyers to enter the market. As Cotality’s Gerard Burg noted, “there’s a limited pool of buyers who can really look to make a purchase of that kind.” When median prices reach these levels, the pool of qualified borrowers shrinks significantly — particularly after rate rises.
Interest Rate Impact
The RBA has raised the cash rate twice in 2026, bringing it to 4.1%. Each 25 basis point increase reduces average borrowing capacity by approximately $20,000–$25,000. Over two rises, that’s a cumulative reduction of around $40,000–$50,000 in what the average buyer can borrow. This has a disproportionate impact on high-price markets like Sydney and Melbourne.
Melbourne’s Supply Dynamic
Melbourne’s well-supplied market is a key differentiator. Unlike Perth, where new construction has stalled, Melbourne has maintained a higher level of dwelling approvals and completions. This gives buyers more choice and reduces the urgency that drives price escalation in supply-constrained markets.
Sydney’s auction clearance rates have also dipped below 50% — a level that historically correlates with flat or declining prices in the months ahead.
What This Means for Property Investors
The Q1 2026 data carries several practical implications for investors evaluating where and when to buy.
1. Location Selection Has Never Mattered More
A “set and forget” approach to Australian property — buying anywhere and expecting growth — no longer works when capital cities can diverge by nearly 8 percentage points in a single quarter. Investors need to evaluate each market on its own fundamentals: supply-demand dynamics, population growth, vacancy rates, and local economic conditions.
2. Cash Flow Markets vs Growth Markets
The divergence creates a clear split between capital growth and cash flow strategies. Perth and Brisbane are currently delivering strong capital growth but have seen yields compress as prices rise. Markets like Mandurah, WA or regional centres may offer better cash flow while still benefiting from WA’s broader demand dynamics.
3. Melbourne May Represent Opportunity
While Melbourne’s short-term numbers are negative, experienced investors often look for entry points during softer market conditions. Melbourne’s fundamentals — population, infrastructure, and economic diversity — remain strong. The current softness could create buying opportunities, particularly in growth-corridor suburbs like Tarneit where long-term demand drivers remain intact.
4. Rate Sensitivity Matters
Properties in high-price markets are more sensitive to interest rate movements. With economists predicting up to three more rate rises in 2026, investors should stress-test their cashflow calculations at higher rate scenarios. A property that works at 4.1% may not work at 4.85%.
Regional Markets: The Quiet Outperformer
One often-overlooked finding in the Q1 data is regional Australia’s continued outperformance. Combined regional dwelling values rose 3.3% for the quarter versus 1.8% for combined capitals, with a national regional median of $758,788.
This continues a trend that Picki has tracked across multiple data sets. As detailed in our analysis of regional versus metro investment performance, regional markets often benefit from higher rental yields, lower entry points, and genuine supply constraints in popular lifestyle and employment markets.
How to Use This Data in Your Research
Quarterly data provides context but should not be the sole basis for investment decisions. Here’s how to integrate these findings into a robust research process:
- Start with macro, then go micro: The Q1 scorecard tells you which broad markets have tailwinds. But price dispersion within each city means suburb-level research is essential. Not every Perth suburb grew 7.3%.
- Cross-reference multiple metrics: Combine quarterly price data with vacancy rates, days on market, vendor discounting patterns, and population growth to build a complete picture.
- Factor in holding costs: A suburb growing at 7% annually but requiring significant negative gearing at current rates may deliver less net return than a moderate-growth suburb with positive cash flow. Run the full holding cost analysis.
- Consider the cycle position: Perth’s 24.3% annual growth is exceptional but raises questions about where the cycle sits. Markets at the beginning of a growth phase offer different risk-reward profiles than markets approaching a peak.
Explore suburb-level data, compare across markets, and model investment scenarios with Picki’s property research tools.
What Comes Next?
The outlook for the remainder of 2026 depends heavily on three factors:
- Interest rate trajectory: The RBA’s decisions over the next two meetings will set the tone. Further rate rises would likely accelerate the Sydney and Melbourne slowdown while potentially moderating growth in Perth and Brisbane.
- Geopolitical uncertainty: REA Group’s Eleanor Creagh noted that conflict in the Middle East is impacting buyer sentiment and energy prices, adding another layer of caution to purchasing decisions.
- Supply pipeline: Markets where new construction remains below population-driven demand (Perth, Adelaide) are likely to continue outperforming those with more balanced supply (Melbourne).
Picki data shows that investors who research at the suburb level — rather than making city-wide assumptions — consistently identify opportunities that broad market averages miss. Whether you’re looking at high-growth markets or seeking value in temporarily softer conditions, the data is the starting point.
Frequently Asked Questions
Which Australian capital city had the highest property price growth in Q1 2026?
Perth led all capital cities with 7.3% quarterly dwelling value growth and 24.3% annual growth as at 31 March 2026, according to Cotality data. Perth’s median dwelling value reached $1,017,698, surpassing the $1 million mark for the first time.
Why are Sydney and Melbourne property prices falling while other cities are rising?
Sydney and Melbourne face a combination of affordability constraints, higher existing price levels, and more balanced housing supply. The RBA’s two rate hikes in 2026 (bringing the cash rate to 4.1%) have disproportionately impacted high-price markets by reducing borrowing capacity. Sydney’s auction clearance rates have also fallen below 50%, a historically bearish signal.
Are regional property markets outperforming capital cities in 2026?
Yes. Combined regional dwelling values rose 3.3% for Q1 2026 compared to 1.8% for combined capitals. Regional Australia’s national median of $758,788 and generally higher rental yields continue to attract investors seeking better cash flow and capital growth potential.
How do interest rate rises affect property investment in different cities?
Each 25 basis point rate increase reduces average borrowing capacity by $20,000–$25,000. This has a greater impact on expensive markets like Sydney (median $1.3 million) than affordable ones like Darwin (median $619,000). In percentage terms, the same rate rise represents a much larger share of borrowing power in high-price markets.
Should I invest in Perth now or wait for the market to cool?
Timing the market is inherently uncertain. Perth’s strong growth is driven by genuine supply-demand imbalance, not speculation, which suggests some durability. However, 24.3% annual growth is above long-term averages and may moderate. Rather than timing the market, focus on suburb-level research: look for areas where supply remains constrained, rental demand is strong, and you can achieve positive or neutral cash flow at current interest rates.
