

How Picki's Overall Investment Score Works: The Weighted Formula That Rates Every Property from 0 to 100
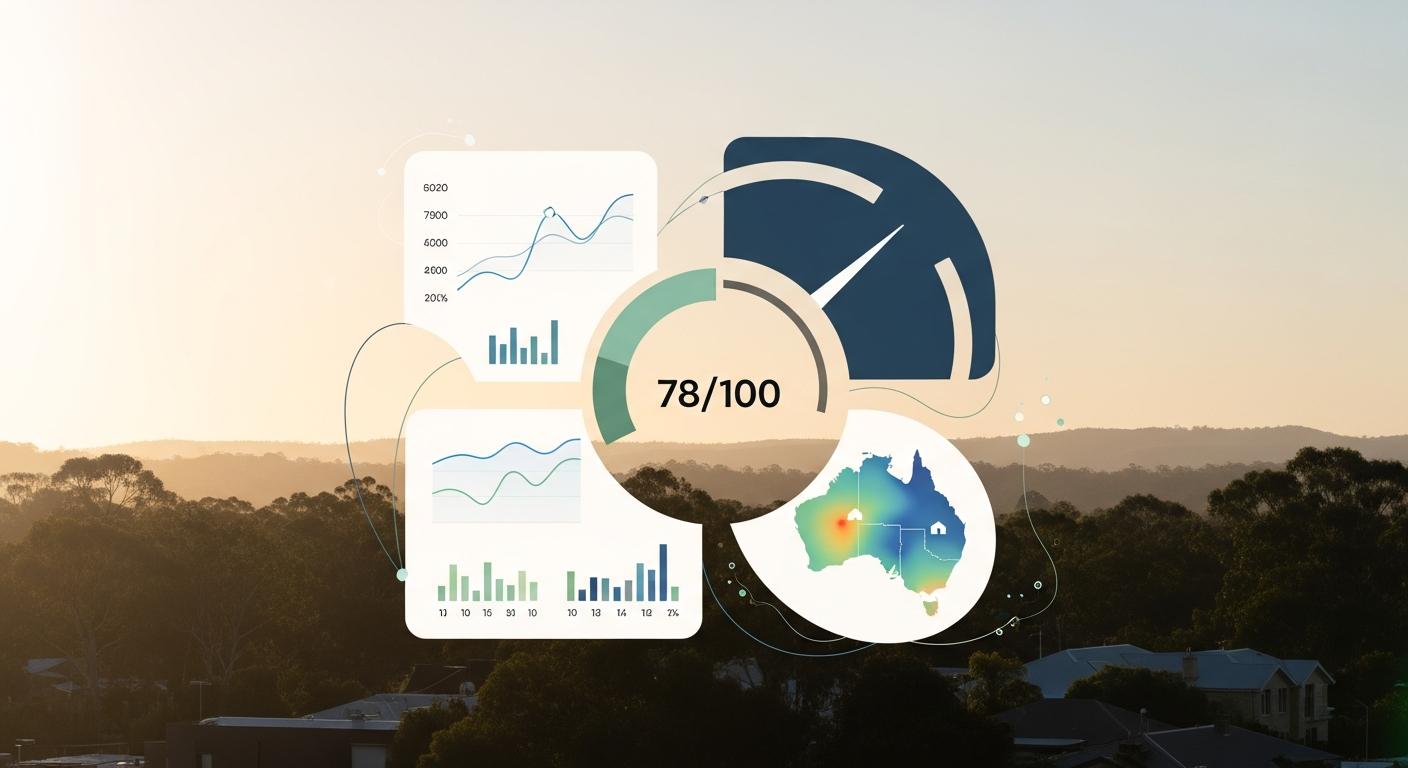
When you look at a property on Picki, the first number you see is the Overall Investment Score -- a single rating from 0 to 100 that combines six distinct metrics into one easy-to-read figure. But what actually goes into that number? Understanding the formula behind it helps you interpret what a high or low score really means, and more importantly, which components are driving the result for any given property.
Key Takeaways
- Picki's Overall Investment Score combines six weighted components into a single 0-100 rating for every property
- The Sweetspot Score (25%) and R Score (25%) together account for half the total weighting, reflecting the importance of street-level desirability and suburb growth potential
- Configuration Score (20%) measures how well a property type matches local demand patterns
- Land Score (15%) evaluates whether the land size is optimal for the area
- Distress Score (10%) indicates potential for vendor flexibility on price
- ROI Factors (5%) capture financial return indicators including yield metrics
- A score of 80+ is rated Very Good, while 60-80 is Good, 40-60 Average, 20-40 Poor, and below 20 Very Poor
Why a Weighted Score Matters
Property investment decisions involve dozens of variables. Rental yield, capital growth potential, local demand, land value, neighbourhood characteristics, and market conditions all compete for your attention. The challenge is not finding data -- it is synthesising it into something actionable.
Picki's Overall Investment Score solves this by applying a specific weighting to each component based on its relative importance to long-term investment outcomes. This is not a simple average. Each component contributes a different percentage to the final score, reflecting the fact that some factors matter more than others when predicting property investment performance.
According to Picki's analysis, the weighting formula is structured as follows:
- Sweetspot Score: 25%
- R Score: 25%
- Configuration Score: 20%
- Land Score: 15%
- Distress Score: 10%
- ROI Factors: 5%
This means that street-level desirability and suburb growth potential together drive 50% of the overall score. That weighting is deliberate -- these two factors have the strongest correlation with long-term property investment returns across Australian markets.
Component 1: Sweetspot Score (25% Weighting)
The Sweetspot Score is the single most granular metric in the formula. It operates at the SA1 (Statistical Area Level 1) level -- essentially your street and immediate neighbourhood -- and measures desirability for capital growth.
Four key factors feed into the Sweetspot Score:
- Owner-occupier ratio: Higher proportions of owner-occupiers typically signal more stable, desirable neighbourhoods. Areas dominated by investors can behave differently during market downturns.
- Public housing concentration: Lower concentrations tend to correlate with stronger capital growth over time.
- Local yield patterns: The relationship between rents and prices at the street level reveals how the market values living in that specific area.
- Price positioning: Where a property sits relative to comparable sales in the immediate area.
A high Sweetspot Score indicates that the property sits in a micro-location that historically supports stronger capital growth. This is why it carries the heaviest weighting -- owner-occupier dynamics and street-level factors often matter more than suburb-wide averages.
Component 2: R Score (25% Weighting)
While the Sweetspot Score looks at the street level, the R Score zooms out to the suburb level and projects forward. It rates a suburb's five-year growth potential from 0 to 100 by analysing:
- Population growth trends: Suburbs attracting more residents typically see rising demand and prices. The relationship between population growth and new housing supply is particularly important.
- Employment and economic factors: Job availability and employment diversity signal economic resilience.
- Infrastructure investment: Government spending on transport, hospitals, schools, and amenities tends to drive property values in surrounding areas.
- Supply pipeline: How much new housing is being built relative to demand.
- Amenity access: Proximity to schools, parks, shopping centres, and public transport.
Picki data shows that suburbs with R Scores above 70 have historically outperformed the broader market in terms of capital growth over five-year periods. A suburb like Kirwan in Townsville, for example, scored 96/100 on its R Score in early 2026 due to strong population growth, tight rental markets, and significant infrastructure investment in the region.
Component 3: Configuration Score (20% Weighting)
The Configuration Score answers a deceptively simple question: does this property type match what local buyers actually want?
It works by comparing the property's type (house, unit, townhouse) to the most common property types in the SA1 area. If most properties in a neighbourhood are three-bedroom houses on 600 square metre blocks, a three-bedroom house on 550 square metres will score higher than a one-bedroom unit in the same location.
This matters because properties that align with local demand patterns tend to:
- Sell faster when you eventually want to exit
- Attract more buyer competition, supporting price growth
- Be easier to rent at market rates
- Maintain value better during market downturns
The 20% weighting reflects the significant impact that dwelling type alignment has on both capital growth and rental demand. A perfectly located property that does not match local preferences will underperform one that does.
Component 4: Land Score (15% Weighting)
The Land Score measures how optimal the property's land size is for its area. Like the Configuration Score, it benchmarks against the SA1 median -- but this time for land area rather than property type.
Properties score highest when their land size is close to the area median. This reflects a fundamental principle of property investment: the land-to-asset ratio is one of the strongest predictors of long-term capital growth.
Why does matching the median matter more than simply having the biggest block? Because:
- Land sizes well above the median may indicate rural-fringe properties with different growth dynamics
- Land sizes well below the median (like units in a house-dominated area) face structural demand limitations
- Properties near the median align with what the local market values, making them easier to sell and more likely to track area-wide growth
In a suburb like Point Cook in Melbourne's west, where the median land size is approximately 450 square metres, a house on 420-480 square metres would score significantly higher than one on 200 square metres or 2,000 square metres.
Component 5: Distress Score (10% Weighting)
The Distress Score is the most tactical component of the formula. Rather than measuring long-term fundamentals, it identifies properties where the vendor may be more flexible on price -- in other words, where you might find a better deal.
Several indicators feed into this score:
- Time on market: Properties listed for extended periods suggest vendor motivation. As covered in our guide to vendor discounting patterns, longer listings often correlate with larger price reductions.
- Price reductions: Multiple price drops signal a vendor who needs to sell.
- Market conditions: Broader market softness in the area increases the likelihood of negotiation opportunities.
At 10% weighting, the Distress Score influences the overall rating without dominating it. A property in a strong location with good fundamentals will not score poorly just because the vendor is not under pressure. But when two properties are otherwise similar, the one with vendor flexibility gives you a potential entry-point advantage.
Component 6: ROI Factors (5% Weighting)
The ROI Factors component captures the property's financial return indicators, including metrics related to gross and net yield. At 5% weighting, it is the lightest component in the formula.
This deliberately low weighting reflects an important philosophical choice in how Picki scores properties. Yield metrics are inherently backward-looking (based on current rents and prices), while the majority of investment returns in Australian property come from capital growth rather than rental income. By giving more weight to forward-looking factors like the R Score and location-quality factors like the Sweetspot Score, the formula prioritises long-term wealth creation over short-term cashflow.
That said, ROI factors still matter. A property with strong fundamentals across all other dimensions but poor yield characteristics may require more upfront capital commitment, which affects your overall return on investment. The 5% weighting ensures this consideration is included without letting it override location and growth fundamentals.
How to Read the Rating Scale
Once all six components are calculated and their weighted contributions summed, the Overall Investment Score falls on a simple scale:
- 80-100 (Very Good): Strong alignment across most or all components. These properties combine desirable micro-locations, high-growth suburbs, appropriate configurations, and optimal land sizes.
- 60-80 (Good): Solid fundamentals with perhaps one or two weaker components. These often represent the sweet spot of opportunity -- good properties that are not yet priced to perfection.
- 40-60 (Average): Mixed signals. Some components score well while others lag. Understanding which factors are driving the score down helps you assess whether those weaknesses matter for your specific strategy.
- 20-40 (Poor): Significant weaknesses across multiple components. These properties typically face structural challenges that limit their investment potential.
- Below 20 (Very Poor): Fundamental mismatches between the property and its market. Rarely suitable for investment without a specific value-add strategy.
Using the Score Strategically
The Overall Investment Score is designed as a starting point, not a final answer. Here is how experienced investors use it effectively:
For shortlisting: When comparing dozens of properties across multiple suburbs, the Overall Score provides a quick filter. Setting a minimum threshold (many investors use 65+) helps narrow the field before deeper analysis. Picki's suburb comparison tool makes this process even more efficient.
For identifying strengths and weaknesses: A score of 72 tells you the property is "Good" -- but understanding that it scores 90 on R Score and 45 on Configuration reveals that the suburb has excellent growth potential while the property type may not be ideal for the area. That insight changes how you evaluate the opportunity.
For matching to your strategy: If your strategy prioritises capital growth over cashflow, you might weigh the Sweetspot and R Score components more heavily in your personal assessment. If you are buying tactically and want to negotiate hard, a high Distress Score matters more to you than to a long-term holder.
For due diligence prioritisation: Properties scoring 70+ across the board warrant deeper investigation -- inspections, detailed cashflow modelling, and local market research. Properties scoring below 50 may not justify the due diligence time unless you have identified a specific angle the data does not capture.
What the Score Does Not Capture
No automated scoring system is perfect. The Overall Investment Score does not account for:
- Property condition: A building and pest inspection reveals issues no data model can detect
- Renovation potential: Value-add opportunities that could transform a property's returns
- Specific tenant quality: Existing lease terms and tenant reliability
- Zoning changes: Future rezoning that could dramatically alter a property's value
- Personal tax situation: How depreciation benefits and your marginal tax rate affect after-tax returns
The score is a powerful filter and comparison tool, but it works best alongside your own research and professional advice. Think of it as the quantitative foundation that your qualitative judgement builds upon.
Exploring Scores Across Different Markets
One of the most instructive ways to understand the scoring system is to compare properties across different market types. A high-scoring property in Blacktown, western Sydney, might derive most of its score from strong R Score and Configuration alignment, while a high-scoring property in Mandurah, Western Australia, might score well on Distress and yield metrics instead.
This variation is by design. The formula adapts to each property's context by benchmarking against local area data rather than national averages. A three-bedroom house in Tarneit, Melbourne, is compared to other properties in Tarneit's SA1 areas -- not to properties in Sydney's eastern suburbs.
Ready to see how properties score in your target areas? Explore suburb profiles on Picki to view Overall Investment Scores, component breakdowns, and market data for suburbs across Australia.
Frequently Asked Questions
How often is the Overall Investment Score updated?
Picki updates property scores regularly as new market data becomes available. This includes updated sales data, rental listings, demographic information, and infrastructure announcements. The frequency varies by component -- market activity data (affecting Distress Scores) updates more frequently than demographic data (affecting R Scores), which typically refreshes quarterly.
Can two properties in the same suburb have very different Overall Investment Scores?
Yes, and this is common. Because the Sweetspot Score operates at the SA1 (street) level and the Configuration and Land scores compare to immediate-area benchmarks, two properties just streets apart can score quite differently. A well-configured house on an optimal block size might score 78 while a poorly matched unit nearby scores 45 -- even though both benefit from the same suburb-level R Score.
Why is the ROI Factors weighting only 5%?
The low weighting reflects the reality that most Australian property investment returns come from capital growth rather than rental income. Historical data consistently shows that location quality and growth potential -- captured by the Sweetspot Score and R Score -- are stronger predictors of total returns over 10+ year holding periods. Yield is important for cashflow management, but it plays a smaller role in long-term wealth creation.
Should I only invest in properties scoring 80 or above?
Not necessarily. Properties in the 60-80 range often represent the best value, as they have strong fundamentals without being fully priced in by the market. The ideal approach is to understand which components are driving the score and whether any weaknesses align with opportunities you can exploit -- such as a low Distress Score indicating room for negotiation, or a Configuration mismatch you can address through renovation.
How does the Overall Investment Score compare to other property rating systems?
Most competing platforms use simpler methodologies -- often a single metric like median growth or yield. Picki's six-component weighted approach is more comprehensive because it captures location quality at both the street and suburb level, incorporates supply and demand dynamics, and considers tactical buying opportunities through the Distress Score. The weighted formula also means that no single factor can distort the overall picture.